Expected Findings


Home    Introduction    Procedure    Troubleshooting    Bibliography    Acknowledgements    Contact Us


After you have collected all of your data you should set up a chart organizing all the numbers you have collected. You should set up a chart for the amount of water you found in the soil. (The percent of water you found after baking.) You should also set up a pH chart with all the pH levels from the soil as well all the iron levels. For the first set of charts, set up the numbers for each trial/day. Make three tables for each day; the amount of water, the pH levels, and the iron levels.
TRIAL 1

Percentage of Water in Soil:

Sample Location % Change in Mass
Site 4 -53.03%
Site 2, 0L added -63.87%
Site 2, 2L added -69.16%
Site 2, 4L added -70.62%
Site 2, 6L added -73.60%
Site 2, 8L added -69.09%
 
 
Iron Test Results:
Sample Location Fe Concentration (ppm)
Site 4 25
Site 2, 0L added 7.5
Site 2, 2L added 16.25
Site 2, 4L added 16.25
Site 2, 6L added 16.25
Site 2, 8L added 16.25
 
pH Test Results:
Sample Location pH Level
Site 4 6.4
Site 2, 0L added 4.4
Site 2, 2L added 4.8
Site 2, 4L added 4.4
Site 2, 6L added 4.6
Site 2, 8L added


4.6 
These tables show all of trail/day 1's information. For most accurate results, you should have at least 4 more days. Also remember that before you added water you took samples for a positive control. Be sure the make a table of this information for the percentage of water and iron levels.


% of Water Lost:


+ 0L 2L 4L 6L 8L
Trial 1 -53.03 -63.87 -69.16 -70.62 -73.6 -69.09
Trial 2 -50.62 -32.65 -29.88 -34.62 -32.93 -28.89
Trial 3 -48.45 -28.65 -30.91 -27.61 -31.52 -32.78
Trial 4 -40.71 -33.23 -38.34 -33.76 -32.69 -30.97
Trial 5


-44.14


-32.11


-31.64


-41.49


-32.36


-35.49


After you have completed the positive control table and the five table, you need to set up three more tables. One needs to be the percent of water loss, one needs to  the pH levels, and the other needs be the iron levels. For each table, you need to have all the trails/days and the amount of water. This table shows the percent of water that was lost in the soil.
   

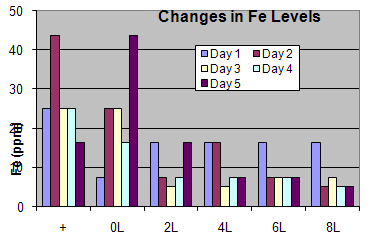
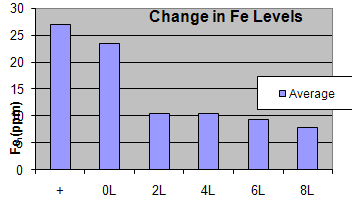
Once you have completed these charts, it would be helpful to set up a graph for each of the tables you have set up. For each topic, you need to make two graphs. One graph should consist of all of the numbers, the other graph should consist of the averages of all the days so that there is only one number per amount of water. In this example, there are two graphs. The first graph shows the levels of iron for each day, the second graph shows the averages of all the days for each level of water.

When computing and understanding your data some helpful kinds of analysis are t-test and linear regression.