|
|
|
||||||||||||||||||||||||||||||||||||||||||||||||||||||||||||||||||||||||||||||||||||||||||||||||||||||||||||||||||||||||||||||||||||||||||||||||||||||||||||||||||
Home Introduction Procedure Troubleshooting Bibliography Contacts Acknowledgments
Sample Data:
You may want to create data tables as shown
below. Additionally, one of the things that you want to do with your data is to analyze
for statistical significance. In order to do so, you would T-Test for
it's significance.
|
|
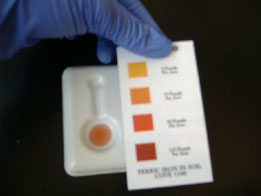
Iron is measured by comparing the shape of orange on the spot plate to the shade of orange on the scale from 5- 125. Convert the reading into parts per million (ppm) using the guidebook provided with the testing kit. | ||||||||||||||||||||||||||||||||||||||||||||||||||||||||||||||||||||||||||||||||||||||||||||||||||||||||||||||||||||||||||||||||||||||||||||||||||||||||||||||||||||||
 |
 |
In order to compare the average iron and mold levels, we suggest creating graphs for accurate results. You may find that mold and iron are, in fact, inversely related. |
Serial Dilution for Fungi (Molds) Equation:
# Microbes in 1 cc of soil = # Colonies on sheet and 102 x 10 |dilution # at which these colonies were found|
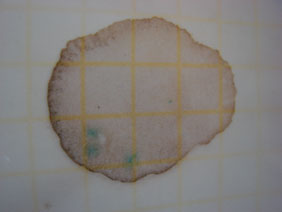 |
When counting mold, look for small fuzzy blue dots. |