.JPG)
E.S.S.R.E 2008
Environmental Science Summer Research Experience for Young Women
PLEASE CLICK ABOVE PICTURE TO SEE OUR POWERPOINT POEM for 2008 (8.75 mb)
Welcome to the home page of the 2008 Environmental Science
Summer Research Experience for Young Women!
This year the program ran from
July 7th to the 25th as we continued previous years study
of the
.JPG) |
.JPG) |
.JPG) |
|
Julianne's Group |
Mr. Brock's Group | MariaLisa's Group |
Step 1. Setting up Sites - Using compasses, tape measures, and GPS each group measured a 20m x 20m plot within their site, placing a pole at each corner (NE,NW,SE,SW). They then marked the midpoints between poles with flags to divide the plot into four equal quadrants.


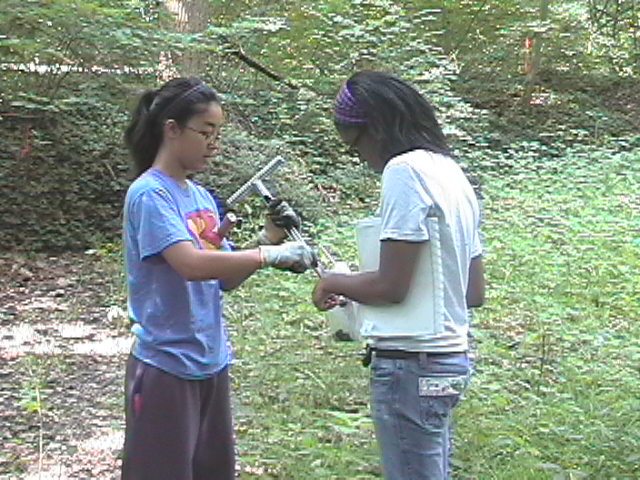
step 2. Taking Soil Samples - next, three soil core samples (A, B, C) at 15cm depth were gathered for each Quadrant. three soil texture samples were also taken for each quadrant and then measured to determine the percentages of sand, silt and clay. once back inside, the soil core samples were placed in corresponding petri dishes and left to dry for later use.

.JPG)

step 3. Protozoa- Each dried soil sample was ground using a mortar and pestle. then, between 9.0 and 10.0 grams of sifted soil was re-hydrated and placed into another Petri Dish. Using a Uhlig extractor created with plastic cups and mesh, the re-hydrated soil was filtered into yet another Petri dish that had been filled with 30mL of distilled water. After weekend refrigeration, the protozoa were filtered a final time using a ring-stand and glass filter. The filtrate was then used to create microscope slides which were examined under new digital light microscopes to get a total protozoa count.
.JPG)
.JPG)

step 4. Chemical testing- the remaining sifted soil was saved and used to create soil "Extracts," which were necessary for many of the chemical tests. Each using the Chemical Test Kit, The groups first measured levels of pH in their sites. Following instructions for how to complete each test, the groups ultimately gathered data for the amount of Calcium, Potassium, Chlorine, Iron, Manganese, Aluminum, Magnesium (Inorganic Abiotic) and Ammonium, Nitrate, Nitrite, Phosphorous (Organic Abiotic).
.JPG)
.JPG)
.JPG)
step 5. Algae- Three locations per quadrat were chosen for Algae analysis and marked with a white flag. Leaving 1.5 cm of a microscope slide above ground, a slide was inserted at each location and then collected 48 hours later. The slide was rinsed with distilled water, sandwiched between two other slides, then placed under a microscope so the algae could be counted.
.JPG)

.JPG)
step 6. Bacteria and Yeast/Mold Counts- Using 1 cc of soil and distilled water, the serial dilution process was completed so that there were five culture tubes with varying degrees of concentration: 10^0, 10^-1, 10^-2, 10^-3, 10^-4. Samples for each of the varying degrees of concentration were plated for Bacteria, while only 10^0, 10^-1, 10^-2 were plated for Yeast/Mold. These were allowed to grow for four days and then each group counted the number of Bacteria (red dots) and Yeast (blue dots)/Mold (gray splotches). A magnified glass proved very helpful! For both Bacteria and Yeast/Mold, the plate with lowest degree of concentration while still showing five growths, was the recorded value.
.JPG)
.JPG)
.JPG)
step 7. Counting Arthropods - For each quadrat, one location was chosen for the arthropod count. a 1/2 m square was dug 15cm deep as group members identified and tallied the various organisms and earthworms. For final data tables, this value was multiplied by four to obtain the number of arthropods per square meter.
.JPG)
.JPG)

step 8. plant transects- Beginning at a chosen site corner (ie: NE pole), groups walked in a straight line to the corresponding diagonal corner (ie: NE pole to SW pole). Along this path, they collected leaf samples from all plants/trees and made note of reoccurring species on that plant's respective Ziploc bag. Bags were then brought inside and species were identified using the newly compiled manual, "Running List of Plant Species in RPCS Backwoods."
.JPG)
.JPG)
.JPG)
step 9. statistical analysis- With instruction from Mr. Brock, Julianne, and MariaLisa, groups learned about Central Tendencies, Standard Deviation, and T-Testing. These, along with other mathematical concepts, were used to consolidate all data into three tables for each group: Microclimate Data Bases
.JPG)
.JPG)
~~~~~~~~~~~~~~~~~~~~~~~~~~~~~~~~~~~~~~~~~~~~~~~~~~~~~~~~~~~~~~~~~~~~~~~~~~~~~
INDIVIDUAL GROUP RESEARCH QUESTIONS
For the second half of the program, the interns were divided into different groups. After having completed analysis of the site data, they were then able to design their own experiments for further investigation of the results.
We encourage you to visit the following links to read each individual group's Research Paper .
Click on each photo to explore that group's web lesson!
| What Is The Effect of Mites on Soil Bacteria? | How Does Aluminum Affect The Fungi in The Ecosystem? | How Does pH Affect Protozoa and Earthworm Levels? |
 |
 |
 |
| |
|
~~~~~~~~~~~~~~~~~~~~~~~~~~~~~~~~~~~~~~~~~~~~~~~~~~~~~~~~~~~~~~~~~~~~~~~~~~~~
IF you have any questions or would like more information about E.S.S.R.E. please feel free to contact the founding program director at STEMteacherEmeritus.rpcs@gmail.com . Contact current program director, Charyl Carmona, at carmonac@rpcs.org
~~~~~~~~~~~~~~~~~~~~~~~~~~~~~~~~~~~~~~~~~~~~~~~~~~~~~~~~~~~~~~~~~~~~~~~~~~~~~
| Soil Ecology Experiments | Research Findings and Results | Biota Survey Protocol | Annotated Soil Bibliographies |
| Click Below Photo to Return to ESSRE HOMEPAGE |
.JPG)