~~~Sample Results~~~
1. After collecting all samples and testing for all chemicals and
microbes, create a table for the fungi and another for the levels of aluminum
and record them with specific labels.
Figure 1:and Figure 2: These are the sets of data showing the number of yeast/mold and the levels of aluminum from DAY 1 soil samples.
|
|
||||||||||||||||||||||||||||||||||||||||||||||||||||||||||||||||||||||||||||||||||||||||||||||||||||||||||||||||||||||||||||||||||||||||||||||||||||||||||||||||||||||
2. Create a table of AVERAGE results for each site in each variable: Yeast / Mold / Aluminum
Figure 3: Average Value Table
| Aluminum and Fungus Data Averages | |||
| Site/Quadrat by Level of Aluminum | Avg. Aluminum | Avg. # of Yeast | Avg. # of Mold. |
| Low (S4Q1) | 64.166 | 28833.33 | 9333.33 |
| Med-Low (S3Q1) | 18.5146 | 65833.33 | 13500 |
| Medium (S4Q2) | 61.66 | 57583.33 | 5083.33 |
| Med-High (S1Q2) | 55.625 | 41416.66 | 4166.66 |
| High (S4Q4) | 13.75 | 31750 | 10333.33 |
3. Perform T-testing and create a table for your p-values.
Figure 4: P-Value Table
| Aluminum T-Testing Results | ||||
| S4Q4 | A | Al T-Test | P-Values | |
| S1Q2 | B | A-B | 0.01237 | |
| S4S2 | C | B-C | 0.761194 | |
| S3Q1 | D | C-D | 0.021497 | |
| S4Q1 | E | D-E | 0.023677 | |
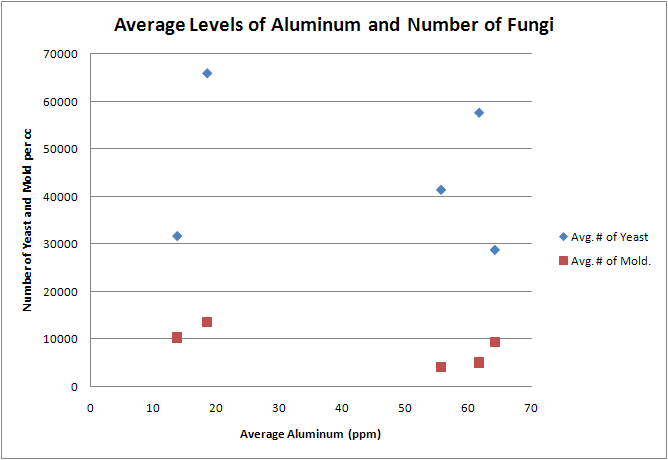
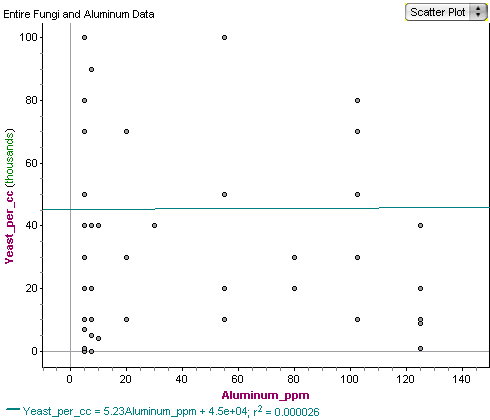
4. Finally create graphs using the previous tables such as...
Figure 5: Example of a Excel Graph

Figure 6: Example of Fathom Graph (to analyze fathom graphs more easily, it is helpful to put the linear regression line on it)
