SAMPLE RESULTS
|
|
While collecting your data, here are some tables we used that might keep you organized. Keep in mind, the tables should be made for all samples in all plots. The data is not actual data collected during our experiment.
For the DO test:
| Plot 1 | DO in Water | DO in soil |
| A | 4.5 | 7.0 |
| B | 6.0 | 7.8 |
| C | 5.6 | 6.2 |
For counting protozoa on the microscope slide
| Plot 1 | Protozoa in View 1 | Protozoa in View 2 | Protozoa in View 3 | Protozoa in View 4 | Protozoa in View 5 | Protozoa Average |
| A | 16 | 14 | 8 | 20 | 15 | 14.6 |
| B | 20 | 23 | 26 | 19 | 24 | 22.4 |
| C | 12 | 15 | 14 | 18 | 14 | 14.6 |
For calculating the density of protozoa. (Number of protozoa per gram of soil)
| Plot 1 | Grams of sifted soil | mL of water added to sifted soil | Average number of protozoa in views | Calculated number of protozoa per gram of soil |
| A | 9.7 | 50 | 14.6 | 56,218 |
| B | 9.5 | 50 | 22.4 | 88,067 |
| C | 9.2 | 50 | 14.6 | 58,635 |
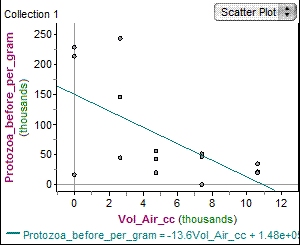
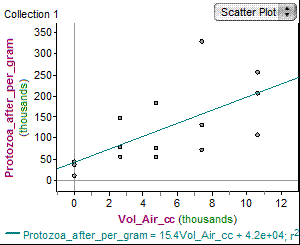
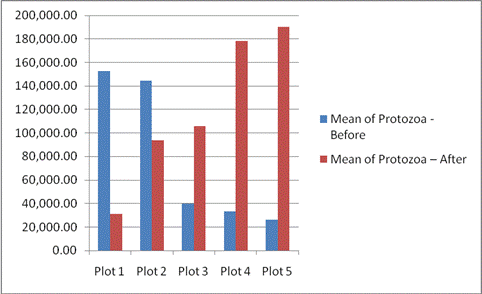
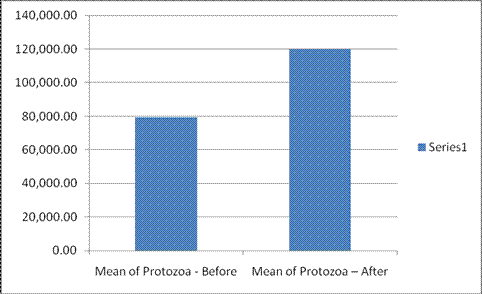
Here are the graphs we created after collecting all of our data. This data is from our findings, and so the pattern you find should look at least a little like the graphs here.
 
|
Graph 3:
  |