Sample Results
![]()
![]()
![]()
![]()
![]()
![]()
![]()
All samples are labeled P1S1, P1S2, etc. This represents
the plot number (1-3) and the sample number (1-5).
When setting up your data tables for this experiment, it
is helpful to put all of the chemical tests into one chart to keep them
organized together
and conserve paper.
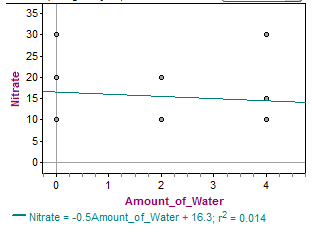
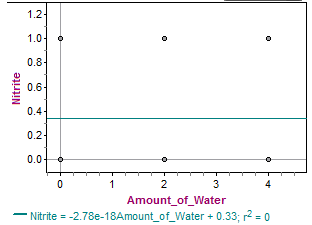
All chemical results are recorded in parts per million (ppm).
| Positive Control |
 |
 |
|||
| Sample | Nitrate | Nitrite | Ammonia | ||
| P1S1 | 30 | 0 | 5 | ||
| P1S2 | 20 | 0 | 5 | ||
| P1S3 | 10 | 1 | 5 | ||
| P1S4 | 10 | 1 | 5 | ||
| P1S5 | 20 | 0 | 5 | ||
| P2S1 | 10 | 0 | 5 | ||
| P2S2 | 20 | 1 | 5 | ||
| P2S3 | 10 | 0 | 5 | ||
| P2S4 | 10 | 0 | 5 | ||
| P2S5 | 10 | 0 | 5 | ||
| P3S1 | 10 | 0 | 5 | ||
| P3S2 | 10 | 0 | 5 | ||
| P3S3 | 15 | 1 | 5 | ||
| P3S4 | 30 | 1 | 5 | ||
| P3S5 | 15 | 0 | 5 | ||
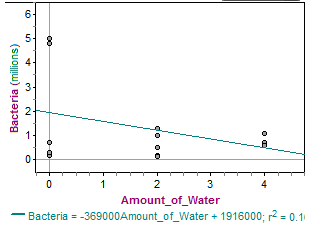
This is an example of a data table for bacteria.
# Microbes in 1 cc of soil = # Colonies on sheet x 102
x 10absolute value of dilution # in which
these colonies were found
| Positive Control |
 |
|||
| Sample | Bacteria | Dilution | Conversions | |
| P1S1 | 48 | -3 | 4800000 | |
| P1S2 | 16 | -2 | 160000 | |
| P1S3 | 32 | -2 | 320000 | |
| P1S4 | 7 | -3 | 700000 | |
| P1S5 | 5 | -4 | 5000000 | |
| P2S1 | 13 | -3 | 1300000 | |
| P2S2 | 16 | -2 | 160000 | |
| P2S3 | 10 | -3 | 1000000 | |
| P2S4 | 13 | -2 | 130000 | |
| P2S5 | 5 | -3 | 500000 | |
| P3S1 | 6 | -3 | 600000 | |
| P3S2 | 7 | -4 | 7000000 | |
| P3S3 | 6 | -3 | 600000 | |
| P3S4 | 6 | -3 | 600000 | |
| P3S5 | 11 | -3 | 1100000 | |
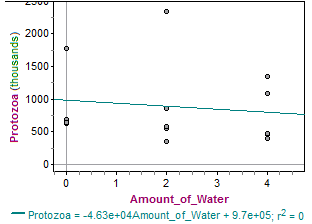
This is an example of a data table for protozoa. Use the
average when calculating the total number of protozoa.
[(# per field view at 40X) x (total ml of water used) x 747] / (grams of sifted
soil) = # of protozoa per gram of soil.
| Experimental |
 |
|||||
| Sample | Field of View | |||||
| 1 | 2 | 3 | Average | Total | ||
| P1S1 | 116 | 217 | 166 | 166.33 | 682684 | |
| P1S2 | 138 | 181 | 988 | 435.67 | 1768725 | |
| P1S3 | 145 | 159 | 195 | 166.33 | 633921 | |
| P1S4 | Lost Data Point | |||||
| P1S5 | 82 | 232 | 149 | 154.33 | 640470 | |
| P2S1 | 680 | 486 | 584 | 583.33 | 2342729 | |
| P2S2 | 87 | 77 | 96 | 86.67 | 348078 | |
| P2S3 | 157 | 123 | 121 | 133.67 | 548635 | |
| P2S4 | 114 | 168 | 154 | 145.33 | 577455 | |
| P2S5 | 385 | 125 | 155 | 221.67 | 862435 | |
| P3S1 | 59 | 152 | 126 | 112.33 | 456035 | |
| P3S2 | 176 | 576 | 297 | 349.67 | 1346410 | |
| P3S3 | 77 | 91 | 150 | 106 | 399909 | |
| P3S4 | 97 | 133 | 136 | 122 | 479653 | |
| P3S5 | 173 | 206 | 432 | 270.33 | 1085680 | |