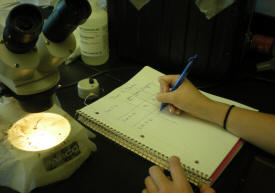
Sample Results & Organizing Your Data
1. When gathering your data, one should organize the information in a well contructed data table including the following:
- Title (Be sure to indicate the trial number that corresponds to the data table)
 - The site and quadrant number in which the data was
retrieved from
- The site and quadrant number in which the data was
retrieved from
- Names of the organism that is to be tallied when gathering data
ie. Ants (Formididae,) Spiders (Araneae,) Crickets (Gryllidae,) Beetles (Coleoptera), etc.
Averages of Site 3 and Site 4
|
Arthropods |
Site 3 |
Site 4 |
Site 3 control |
Site 4 control |
|
Formlcdae |
181 |
111.1667 |
37.66666667 |
0 |
|
Araneae |
0.166667 |
4.333333 |
1 |
0 |
|
Geophilomorpha |
0 |
0.5 |
0 |
0 |
|
Gryllidae |
2.333333 |
2 |
5 |
0 |
|
Coleptera |
0 |
0 |
0 |
0 |
|
Isoptera |
0 |
0 |
0.333333333 |
0 |
|
Acarl |
0.666667 |
0 |
0 |
0 |
|
Armadillidildae |
0 |
0 |
0.666666667 |
2.333333333 |
|
Lumbricina |
0 |
0 |
0 |
0.333333333 |
|
Culicidae |
0.166667 |
0.166667 |
0 |
0 |
|
Orthoptera |
0 |
0.5 |
0 |
0 |
|
Lepidoptera |
0.166667 |
0 |
0 |
0 |
Figure 1: This
table shows the averages in site 3 and site 4 and there controls
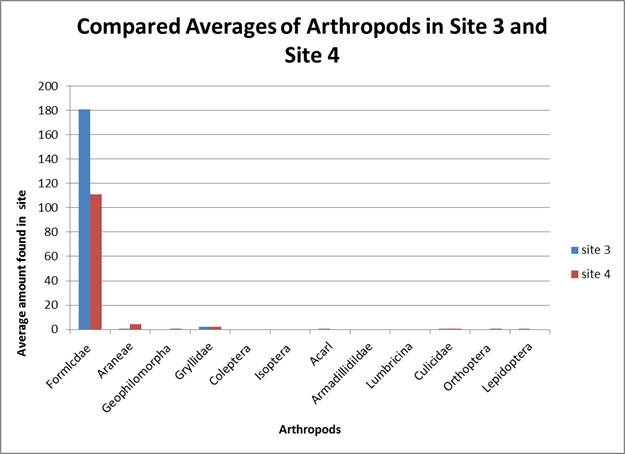
Figure 2:
this graph compares each arthropod in site 3 and site 4
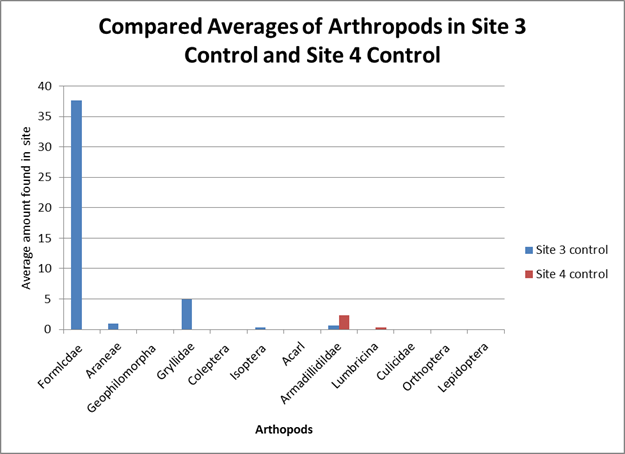
Figure 3:
this graph compares the averages of the arthropods in site 3 control and site 4
control