| Introduction | Procedure | Troubleshooting | Bibliography | Contact | Acknowledgements |
Sample Results
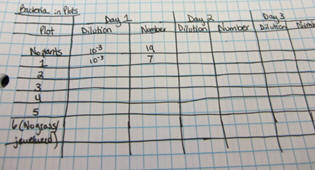
In order to keep everything easily organized, you may want to create a data table that contains the density of white grass, nitrate levels, and bacteria levels for one day. When converting nitrate from pounds per acre to parts per million, it is important to remember to divide by two. Also the following formula is used to estimate the number of bacteria in 1 cc of soil. # Microbes in 1 cc of soil = # Colonies on sheet x 102 x 10|dilution # at which these colonies were found|. Below are two examples of how your data tables might look.
|
Density of White Grass, Nitrate Levels, and Bacteria Levels for Day 1
| Plot | Density of White Grass (cm2) | Nitrate Levels (ppm) | Bacteria Levels (#/cc) |
| No Plants | 0 | 10 | 1900000 |
| 1 | 0.002 | 10 | 2000000 |
| 2 | 0.014 | 5 | 700000 |
| 3 | 0.025 | 15 | 6000000 |
| 4 | 0.040 | 5 | 1200000 |
| 5 | 0.029 | 5 | 1600000 |
| No White Grass
or Jewelweed |
0 | 5 | 1300000 |
Density of Jewelweed, Nitrate Levels, and Bacteria Levels for Day 2
| Plot | Density of Jewelweed (cm2) | Nitrate Levels (ppm) | Bacteria Levels (#/cc) |
| No Plants | 0 | 15 | 1300000 |
| 1 | 0.005 | 5 | 900000 |
| 2 | 0.005 | 10 | 1300000 |
| 3 | 0.012 | 5 | 910000 |
| 4 | 0.008 | 5 | 700000 |
| 5 | 0.002 | 10 | 1700000 |
| No White Grass or Jewelweed |
0 | 5 | 600000 |
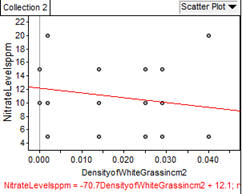
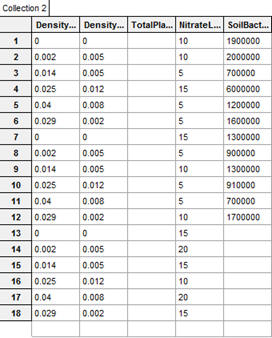
The following are examples of how you can organize and display your data using a program such as FathomTM.
Nitrate Levels vs. Density of White Grass
 |
Density of Jewelweed, Density of White Grass, Total Plant Density, Nitrate Levels, and Bacteria Levels
 |