Sample Results
Here is am example of a table showing how you
should set
up your data table.
Data Table ( Day 1)
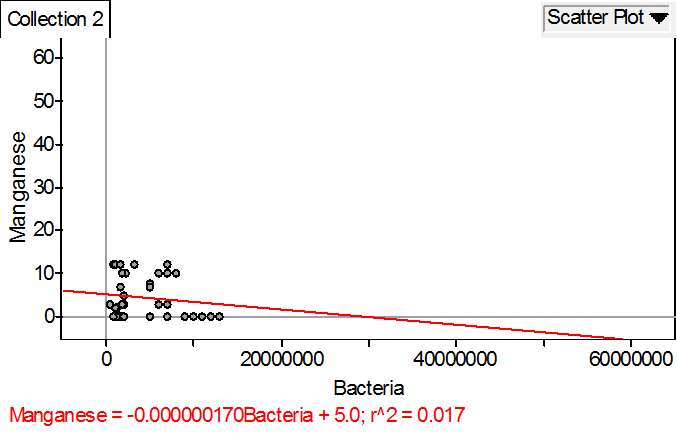
Here is an example of what your graph should look like
after collecting 4 days of data.
Graph 1 (All Data)
|
Manganese (ppm) |
Number of Bacteria |
Percentage of
Moisture |
||
|
Day 1 |
Bacteria Sample NC |
0 |
12000000 |
35% |
|
Bacteria Sample Q1 |
7.5 |
5000000 |
37% |
|
|
Bacteria Sample Q2 |
12 |
900000 |
21% |
|
|
Bacteria Sample Q3 |
3 |
2000000 |
29% |
|
|
Bacteria Sample Q4 |
0 |
52000000 |
38% |
|
