![]()
![]()
![]()
![]()
![]()
![]()
![]()
Procedure
Independent variable: Moisture levels (between
0 and 2 liters)
Dependent varibale: Fungi (# in 1 cc of soil) & Sulfur levels (ppm)
Negative control: Plot 5 with zero percent moisture Positive control: before samples
Materials Used
|
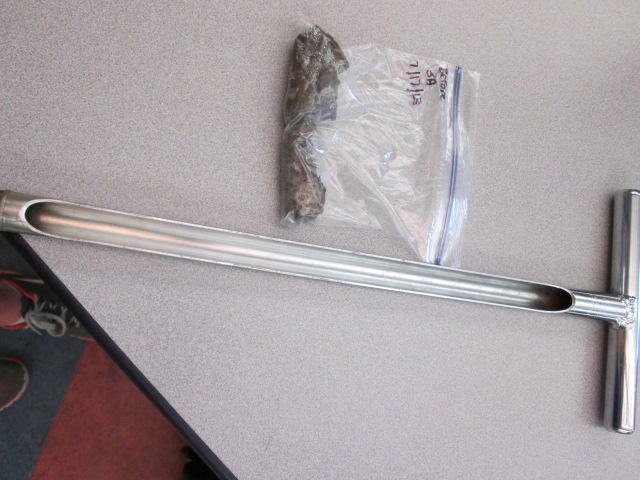
Soil extractor |
20 Flags
|
Two liter measuring cups |
15ml Test tubes |
Funnels |
|
Lab table |
Filter paper
|
fungi nutrient agar plates |
Test tube rack |
Sterile Water
|
|
Safety goggles |
soil chemistry test kit |
At least 30 sandwich sized plastic baggies |
Field notebook |
pipets |
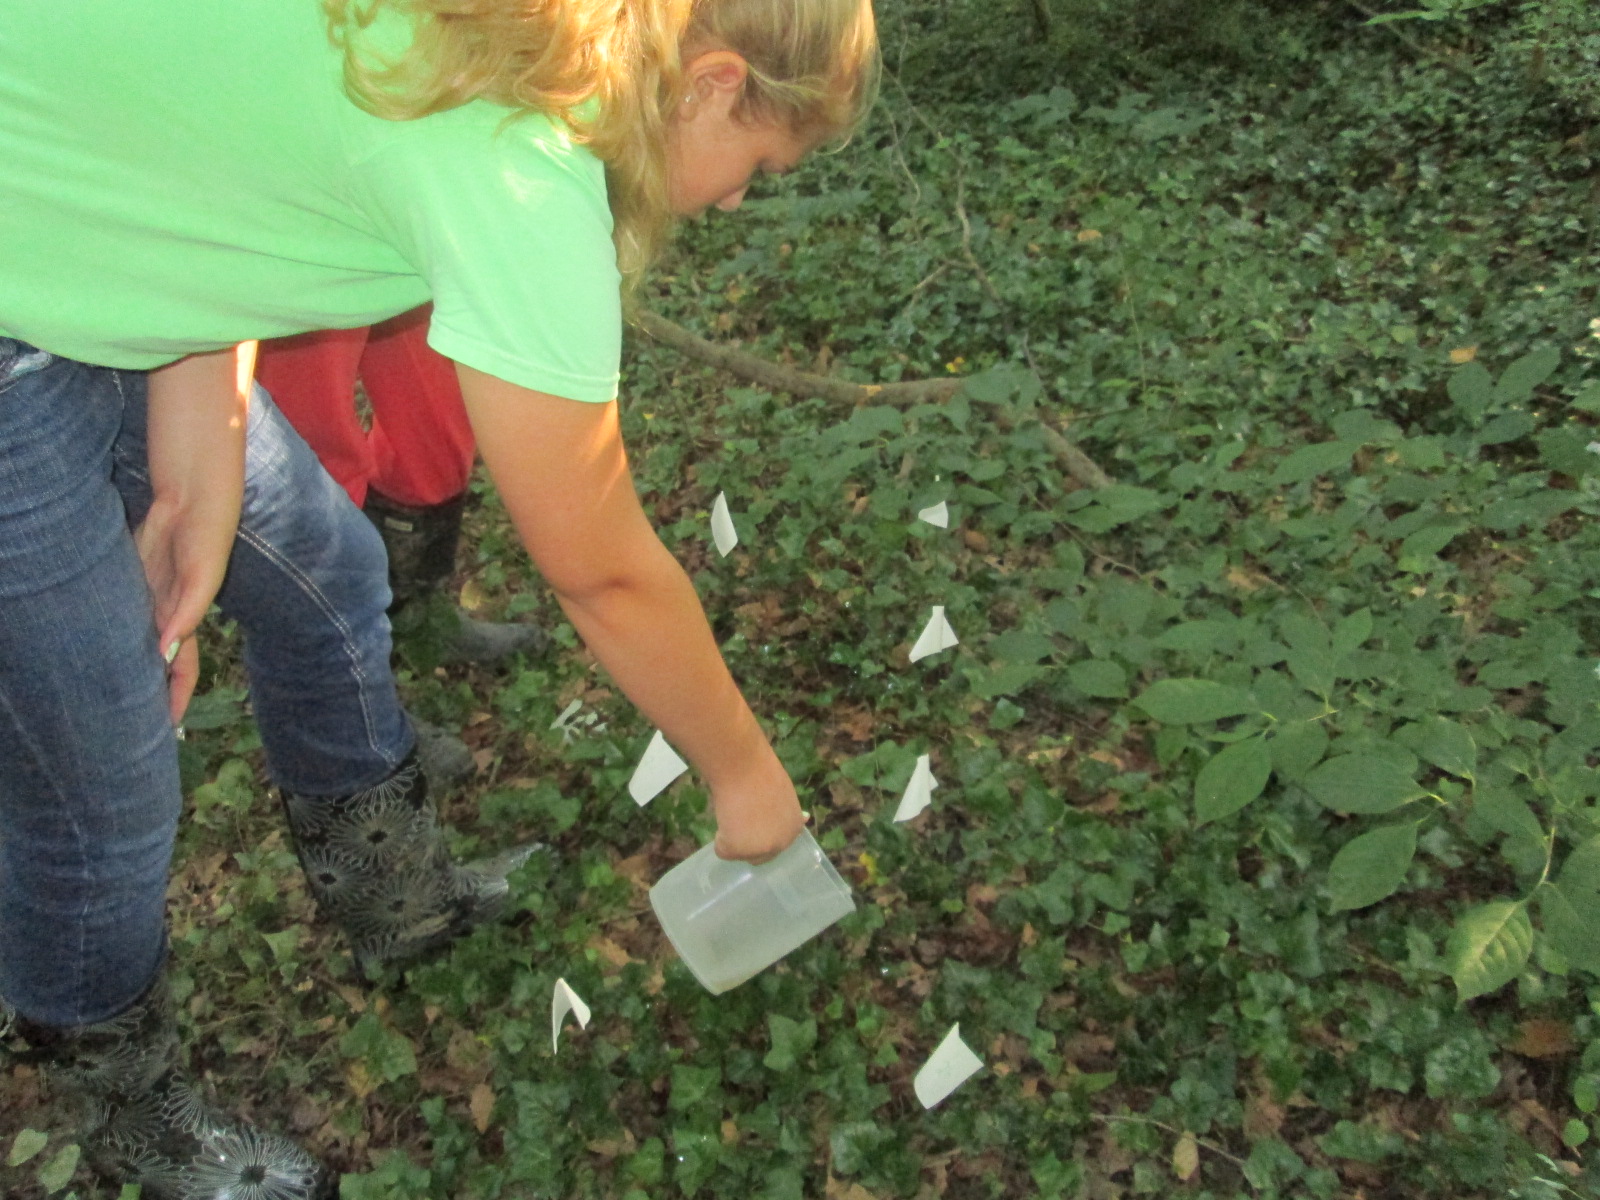
Step by Step
1.
Establish 5 30 cm by 30 cm
research plots that are 30 cm apart from each other in a site with low plant
diversity and rather widespread moisture.
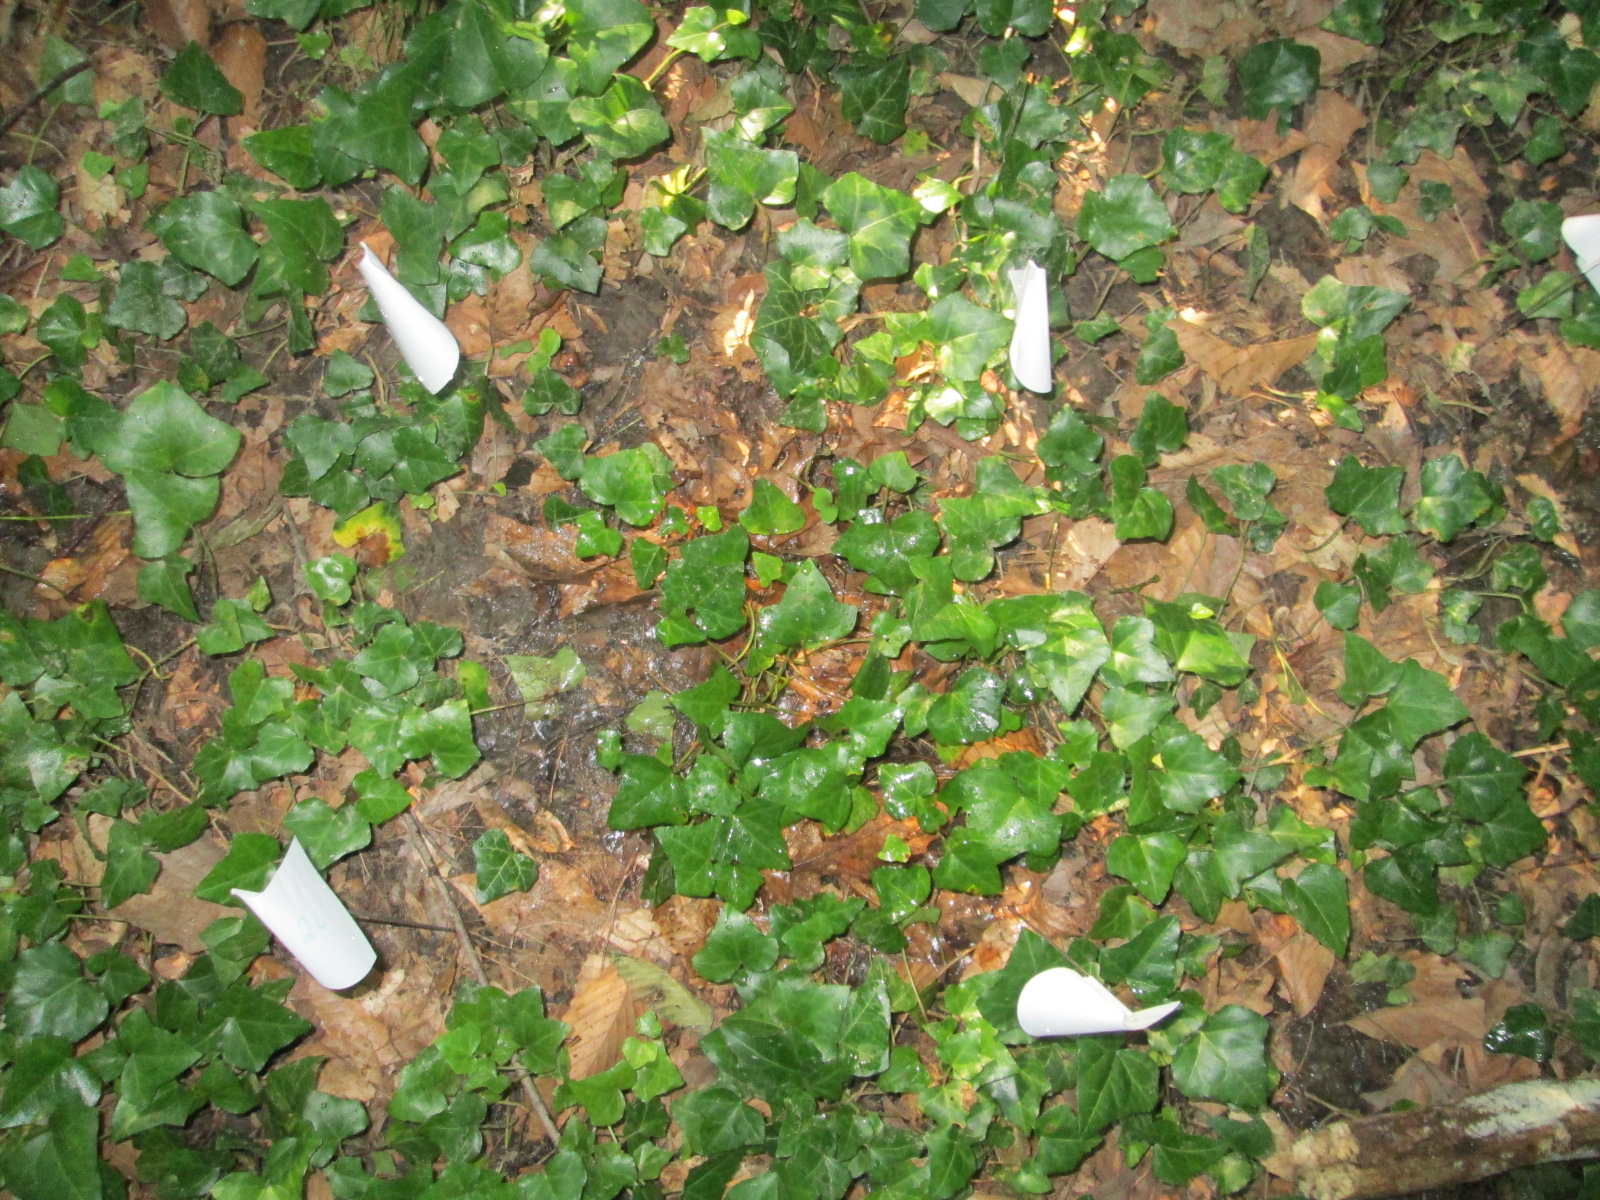
2. Put four flags at each corner of the plot with the number plot that it is in order to label the plots
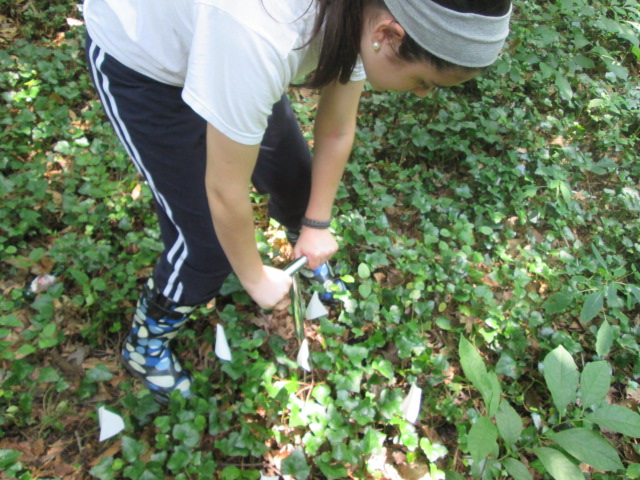
3. Take three 15 cm deep and 2 centimeters in diamter soil core samples from each of the five plots before beginning the experiment in order to establish a positive control variable.
4.
Test the soil for sulfate levels (ppm) using a
chemical test kit while doing
serial dilutions at the
same time in order to ensure the time is controlled for all samples. Dilute to
the level of
10-2.
Plate
100 µL of all 3 dilutions on their own
nutrient agar plates.
.JPG)
5. Grow the plates for 72 hours and observe for both yeast and mold quantaties. After sulfate tests and serial dilutions are complete, record results in data table.
6. Then begin the
experiment by adding 2L of water to the first subplot, 1.5L to the second
subplot, 1L to the third subplot, .5 L to the fourth subplot, and add no water
to the final subplot
7. In order to super saturate the sites to increase the chance of good results, repeat step 6 two times a day for two days.
8. Let the subplots sit for at least 2 days
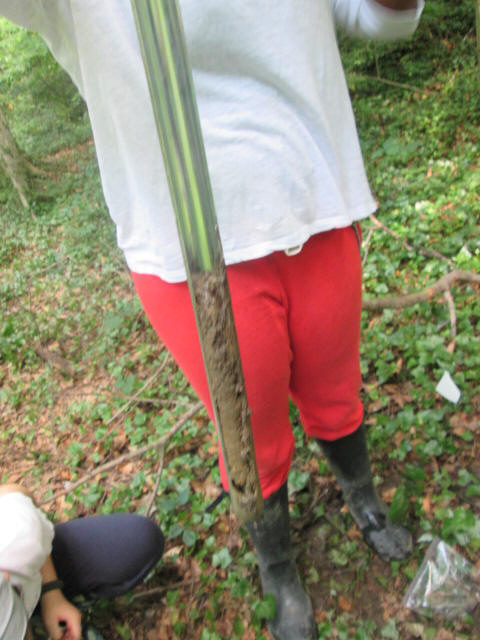
9. Collect three 15 cm deep and 2 centimeters in diameter soil core
samples from each of the five plots
10. Repeat step
4-5 with
the new samples.
11. In order to analyze your data, look at the before and after data. Compare sulfur levels to yeast, mold and total fungi levels. You want to have graphs that contain the data for sulfur levels (before and after) at each of the moisture levels, fungi levels (before and after) at each of the moisture levels, yeast levels (before and after) at each of the moisture levels, mold levels (before and after) at each of the moisture levels, and a graph comparing the total fungi levels to the sulfer levels.