We chose to label our tables based on the location from which we took the samples in the first column, and the level of nitrate found in the second column.
Sample Results
| Home | Introduction | Procedures | Troubleshooting | Bibliography | Acknowledgments | Contact |
Sample data:
Below are examples of data charts and graphs that could be used with our procedure.
Data Charts
We chose to label our tables based on the location from which we took the
samples in the first column, and the level of nitrate found in the second
column.
Graphs
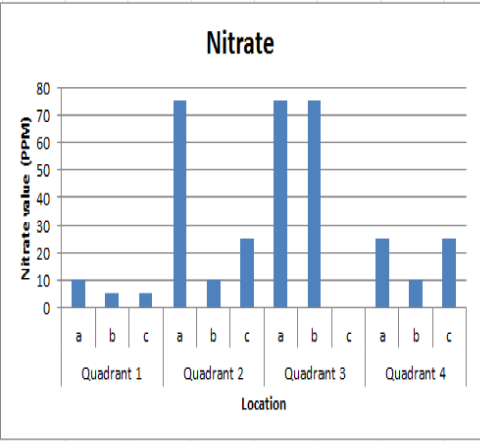
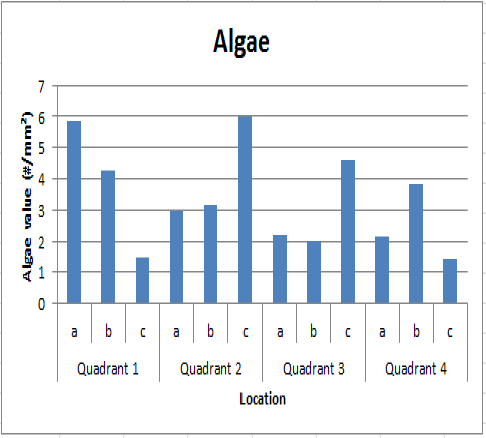
We chose to display our nitrate and algae
data in a bar graph to visually assess it.
In order to analyze the data you have collected,
create a chart with the P-values obtained from a t-test. This will allow
you to determine the significance of certain parts of the data.