SAMPLE RESULTS
This is a sample of what we found in our experiments. This should provide an example on how you should set up your chart to record your findings or to compare your results. Your results will not be exactly the same as ours.
 |
Independent Variable Soil texture, pH, and Algae Day 1
|
Location |
pH Value |
Clay % |
Algae calculated value |
|
Day 1 Site 1 |
|||
|
1A |
4.8 |
2.9 |
1.38 |
|
1B |
6.0 |
3.4 |
0.91 |
|
1C |
5.2 |
1.6 |
0.13 |
|
Day 1 Site 2 |
|||
|
2A |
3.8 |
3.0 |
2.80 |
|
2B |
4.4 |
2.8 |
2.30 |
|
2C |
4.6 |
1.4 |
2.47
|
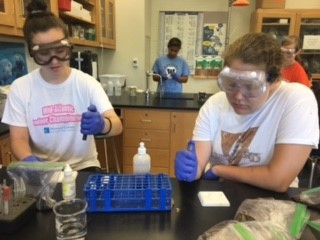
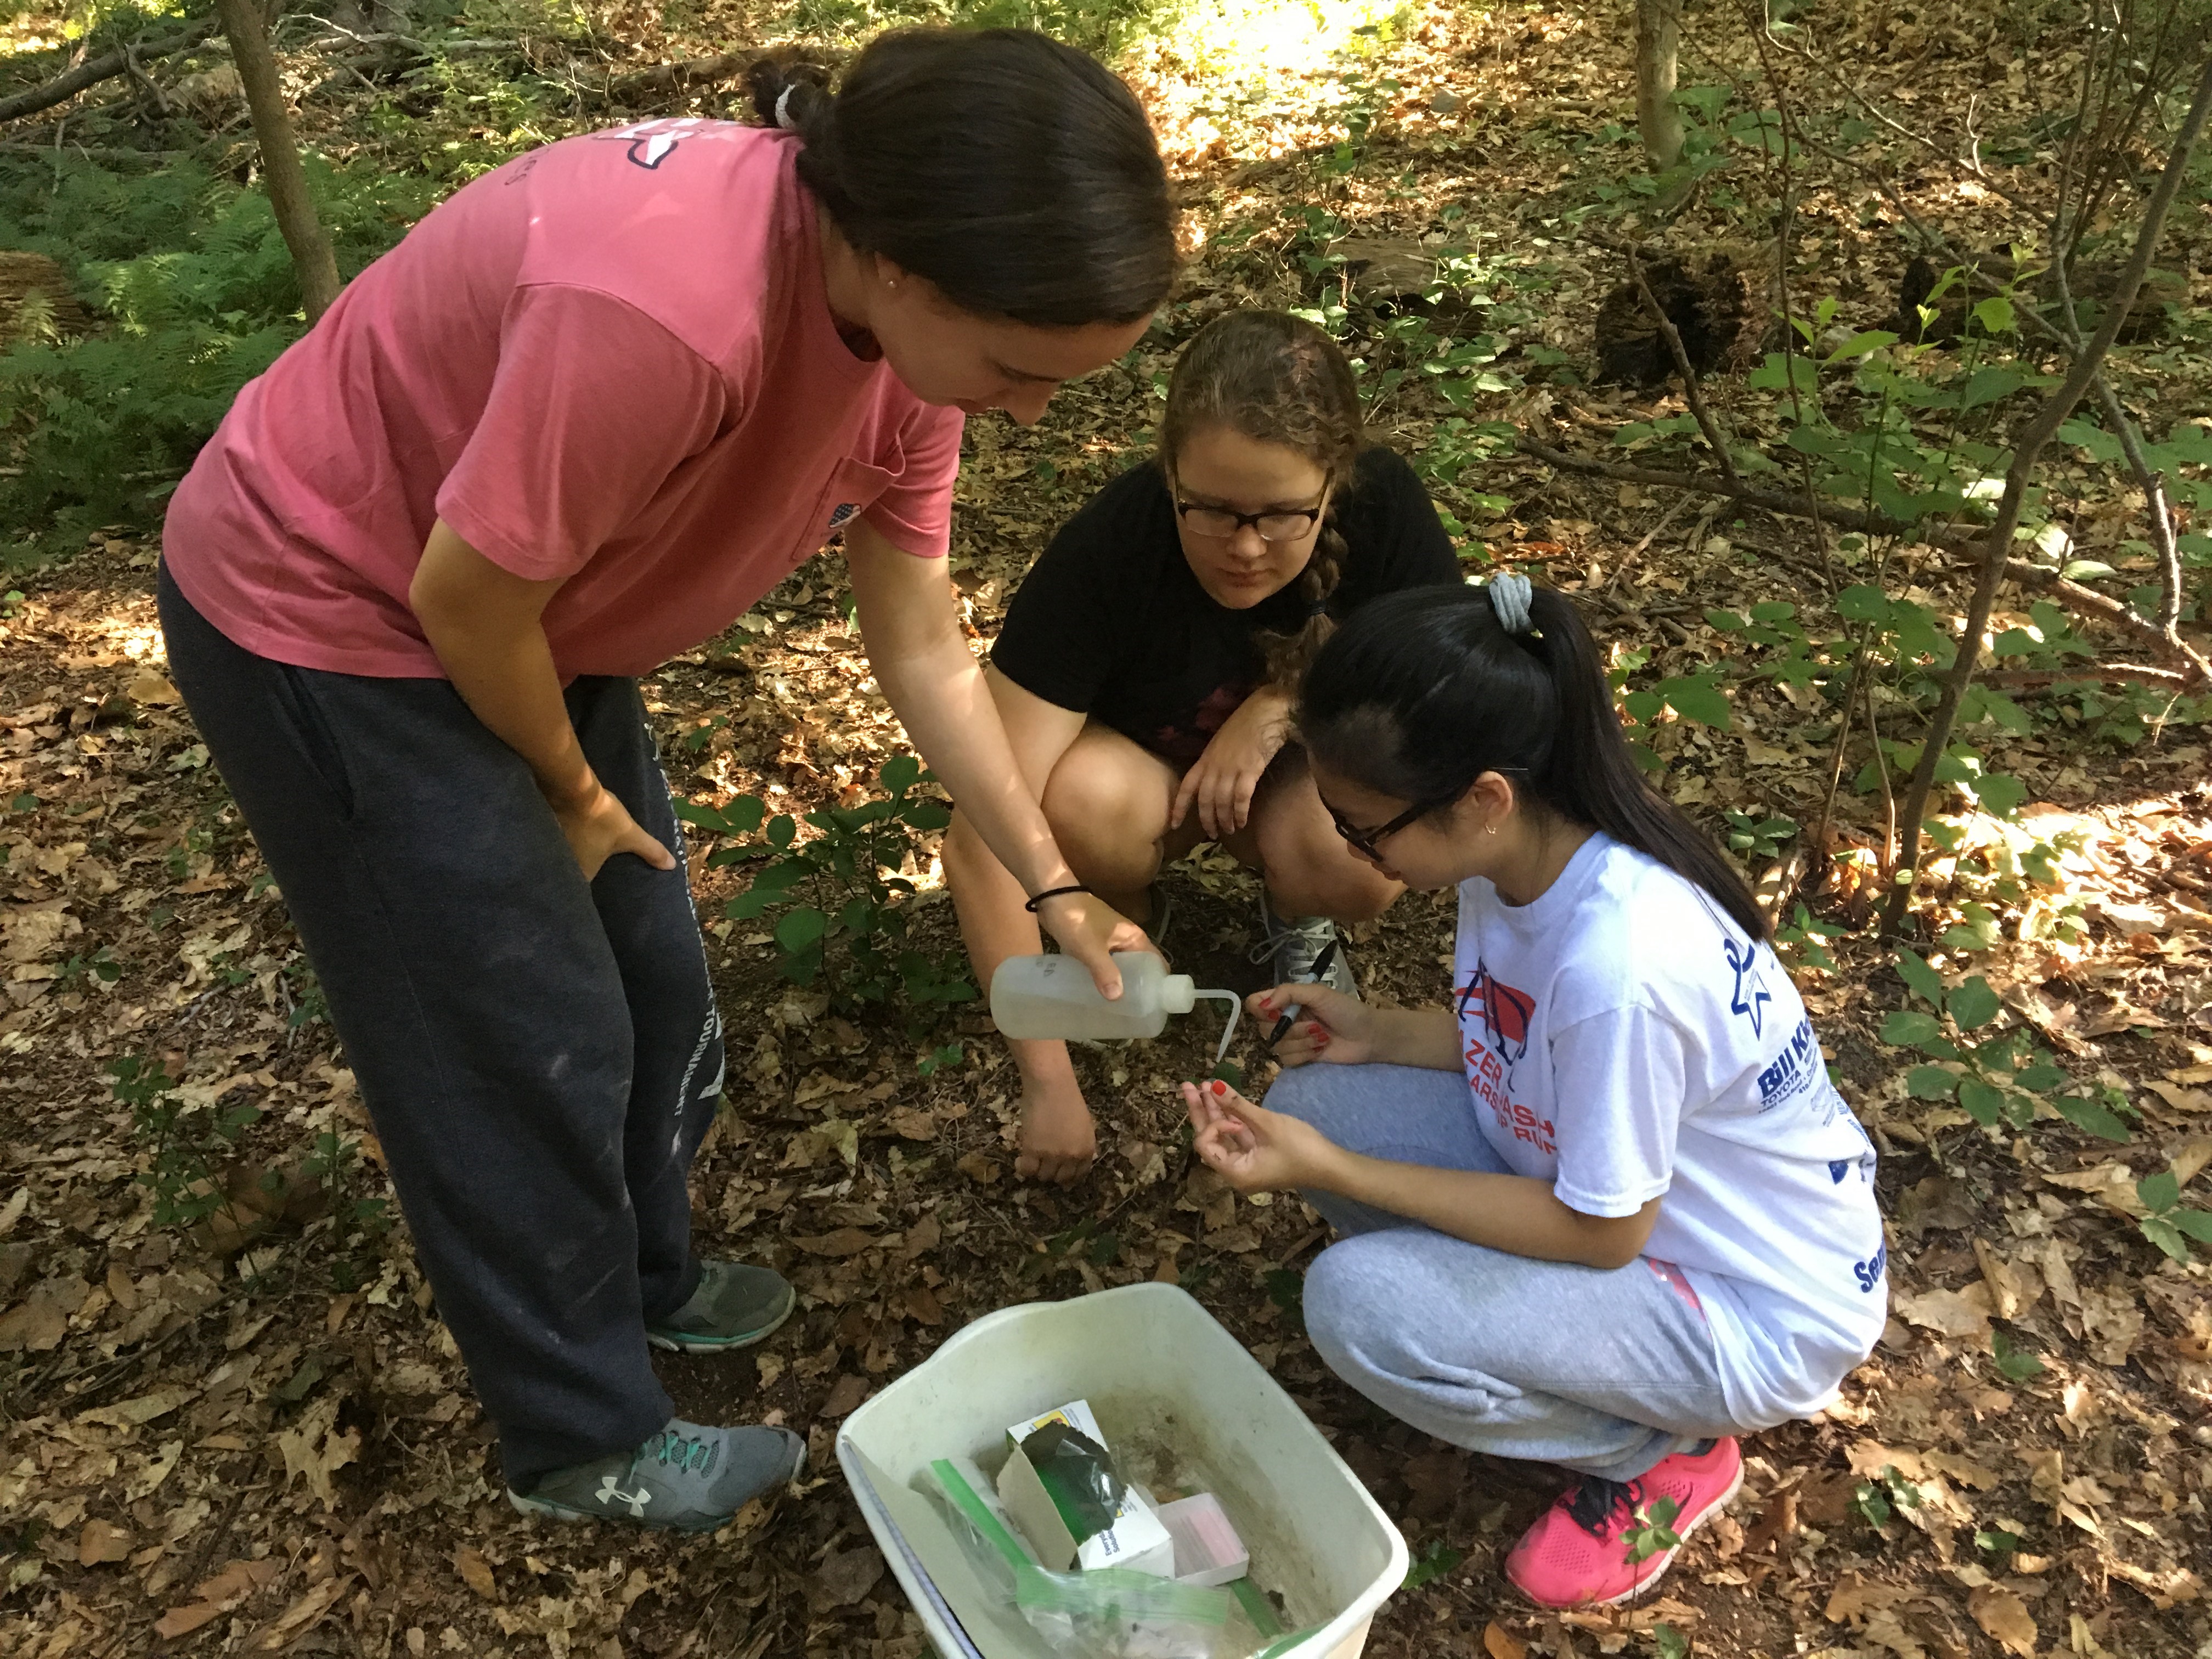
For algae data, we counted the amount of algae in 5 different field of views for each slide collected and then averaged them to then create the calculated value. In order to get different 5 fields of view, use the stage adjustment knobs to move to different spots on the slide.
Results for the algae test Site 1 Day 1
|
Location: Site 1 |
Field of View
|
Average Field of View |
/17.3=
Calculated Value
|
|||||||||
|
1A |
39 |
20 |
41 |
4 |
17 |
23.8 |
1.38 |
|||||
|
1B |
15 |
36 |
8 |
13 |
7 |
15.8 |
.91 |
|||||
|
1C |
0 |
2 |
4 |
0 |
5 |
2.2 |
.13 |
|||||
|
4A |
6 |
29 |
46 |
3 |
5 |
16.80 |
.97 |
|||||
|
4B |
34 |
43 |
46 |
65 |
36 |
44.80 |
2.6 |
|||||
|
4C |
12 |
54 |
18 |
71 |
15 |
34 |
1.9 |
|||||
Graph for algae, pH, and soil texture Day 1.
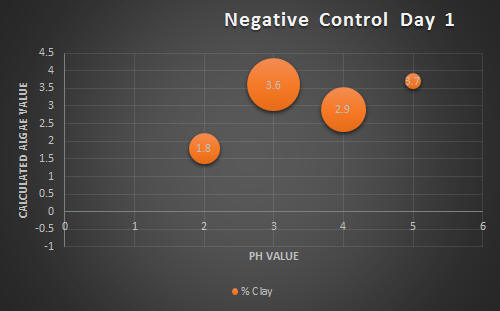
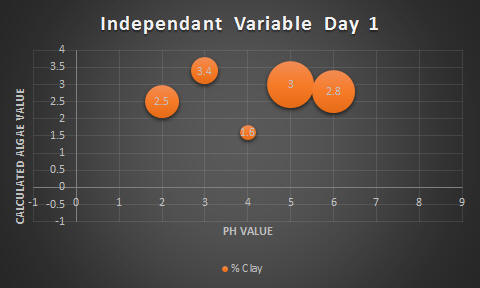
We used this kind of graph because there are 3 components: clay, pH value, and algae. The graph is for 3D data.