|
|
 |
 |
|
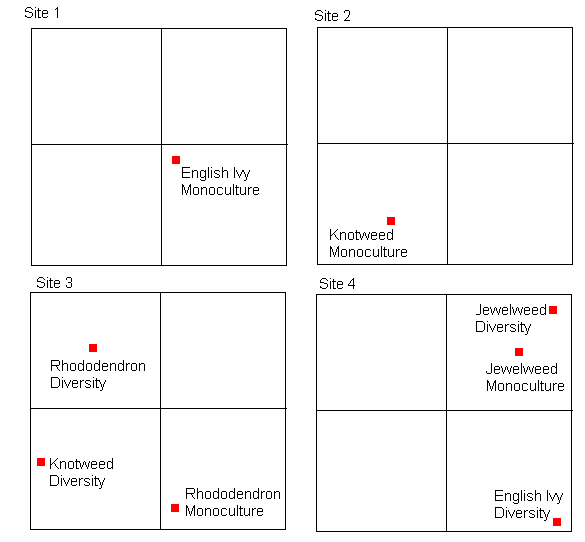
Places where centipede counts were taken: |
|
|
|
||||||||||||||||||||||||||||||||||||||||
|
As can be seen in graph 1, an average of 91 more centipedes per meter square were found in the experimental plots then the negative control. Upon t-testing the data, a p-value of 0.006 was found. This shows that the difference in centipede density between the variable and the control plots was statistically significant.
As can be seen in graph 2 there is on average 72 more centipedes/ meter square found in the plots containing a monoculture of plant species then a plot where plant species were diversified. Upon t-testing the data a p-value of 0.12 was found, which shows that there is only an 88% likelihood that the difference in centipede density is due to an absence of plant diversity.
As seen in Graph 3 the density of centipedes in the plot containing a monoculture of rhododendron was 76 greater than the next greatest monoculture plot. Upon performing a chi-square test, a chi value of 71.85 was found, showing that we can be 99.9% certain that plant type has a strong correlation to centipede populations and that the alternative hypothesis hold true. This statistical significance implies that centipedes prefer a rhododendron dominated environment over one dominated by jewelweed, knotweed and English ivy.
|
Home | Introduction | Procedure | Results & Analysis | Troubleshooting
Pictures| Contact Information | References | Acknowledgements