 Got Calcium?...Site Three Does!
Got Calcium?...Site Three Does!
Here is an example of our data table while we were collecting our data:
| Day | Location | Calcium Level (ppm) |
| 1 | B1 | 350 |
| 1 | B2 | 350 |
| 1 | B3 | 700 |
| 1 | M1 | 350 |
| 1 | M2 | 700 |
| 1 | M3 | 1400 |
| 1 | T1 | 350 |
| 1 | T2 | 1400 |
| 1 | T3 | 1400 |
| 2 | B1 | |
| 2 | B2 | |
| 2 | B3 | |
| 2 | M1 | |
| 2 | M2 | |
| 2 | M3 | |
| 2 | T1 | |
| 2 | T2 | |
| 2 | T3 |
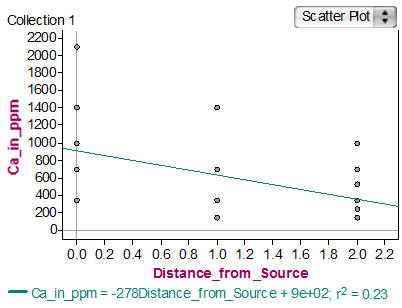
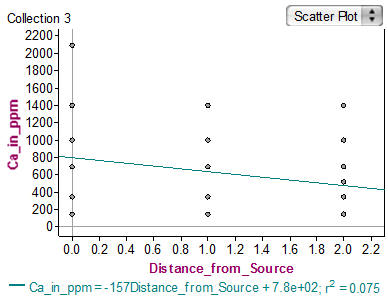
Distance from Stormwater Management Source Moving Downhill Distance from the Bedrock Moving Downstream
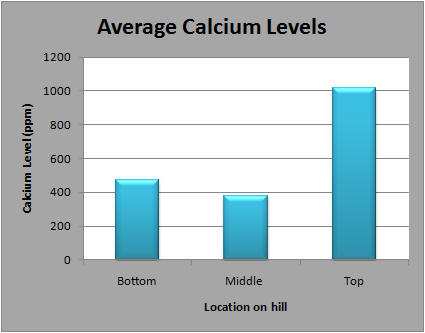
Comparison of Calcium Levels from Different Location on the Hill
The background on this page is from: http://us.fotolia.com/id/18503353
The calcium picture on this page is from: http://www.eatrundoyoga.com/blog/vegan-myth-calcium/