Sample Results
|
This is an example of what a table
might look like when collecting the data for this experiment. More
collumns are neccessary for the remaining sun exposure levels. Rows
might also need to be added depending on how many days data is
collected.
|
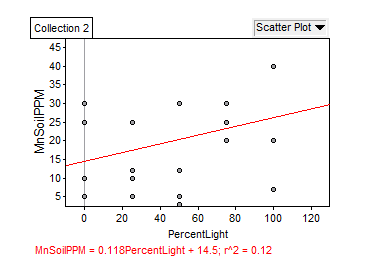
This is an example of what a graph
might look like after all the data is collected.
|
|||||||||||||||||||||||||||||||||||||||||||||
|
 |
|||||||||||||||||||||||||||||||||||||||||||||