| This is an example of a data table you could make when
you are collecting. |
| |
|
Site |
Sample
Location |
Microscope Slides |
Trials |
Average |
Average per location |
|
2 |
a |
|
1 |
2 |
3 |
4 |
5 |
|
9.04 |
|
i |
13 |
15 |
7 |
6 |
12 |
10.6 |
|
ii |
4 |
3 |
6 |
9 |
9 |
6.2 |
|
iii |
3 |
5 |
15 |
19 |
13 |
11 |
|
iv |
8 |
4 |
7 |
5 |
9 |
6.6 |
|
v |
19 |
11 |
5 |
6 |
13 |
10.8 |
|
b |
i |
5 |
2 |
7 |
8 |
12 |
6.8 |
7.84 |
|
ii |
17 |
23 |
18 |
4 |
11 |
14.6 |
|
iii |
8 |
4 |
15 |
2 |
4 |
6.6 |
|
iv |
9 |
3 |
6 |
4 |
5 |
5.4 |
|
v |
4 |
7 |
9 |
6 |
2 |
5.8 |
|
c |
i |
11 |
6 |
3 |
5 |
7 |
6.4 |
5.2 |
|
ii |
8 |
2 |
5 |
7 |
4 |
5.2 |
|
iii |
13 |
0 |
9 |
2 |
5 |
5.8 |
|
iv |
2 |
3 |
16 |
0 |
3 |
4.8 |
|
v |
3 |
2 |
4 |
3 |
7 |
3.8 |
|
| |
| This is an example of a table you may make after
collecting your data and perfoming a
T-Test
to calculate your p-values for the algae and
earthworms in the sites. The p-values help show significant differences
between the sites. |
|
Algae T-Test Results
|
|
|
Sites
|
P-values
|
|
1 & 2
|
0.000000078
|
|
1 & 3
|
0.00000009
|
|
1 & 4
|
9.10E-09
|
|
2 & 3
|
0.54
|
|
2 & 4
|
0.000006
|
|
3 & 4
|
0.000083
|
|
|
Earthworm T-test Results
|
|
|
Sites
|
P-values
|
|
1 & 2
|
0.39
|
|
1 & 3
|
0.39
|
|
1 & 4
|
0.19
|
|
2 & 3
|
1
|
|
2 & 4
|
0.22
|
|
3 & 4
|
0.22
|
|
| |
|
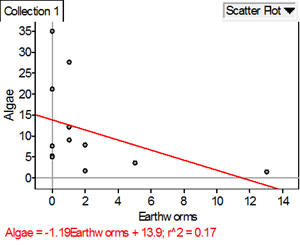
| This is an example of what your graph may appear after collecting your data. |
 |