
| Home | Introduction | Procedure | Trouble Shooting | Bibliography | Contacts | Acknowledgements |
| Full Data Table for Day 1 | P-values for humus and phospherus tables | ||||||||||||||||||||||||||||||||||||
 |
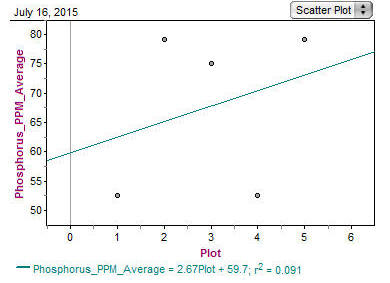
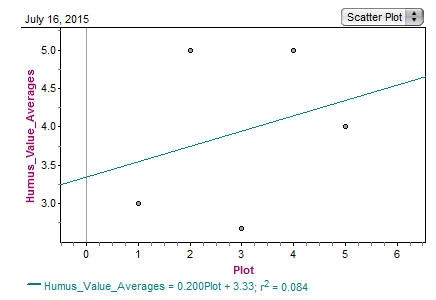
phosphate Plots compared P- value 1 – 2 .253 1 – 3 .884 1 – 4 .144* 1 – 5 .002* 4 – 5 .044* Humus Plots compared P- value 1 – 2 .0000179 (1.791 10-5)* 2 – 3 .0000527 (5.273 10-5)* 3 – 4 .00251* 4 – 5 .467 2 – 4 .028* 2 – 5 .000252 (2.52 10-4)* |
||||||||||||||||||||||||||||||||||||
|
(this is an example of how to set up your data table) An ordinal scale was used for the Humus Test showing Decomposition. Value 5 indicates the highest level of decomposition Value 1 indicates the lowest level of decomposition. |
|||||||||||||||||||||||||||||||||||||
| Phosphorus scatter plot | Humus Scatter Plot | ||||||||||||||||||||||||||||||||||||
 |
 |
||||||||||||||||||||||||||||||||||||