| Home | Introduction | Procedure | Trouble Shooting | Bibliography | Contacts | Acknowledgements | |
PHOSPHATES R US
Sample Results:
These are some examples of graphs and tables that can be used for phosphorus data and moisture of soil data.
|
|
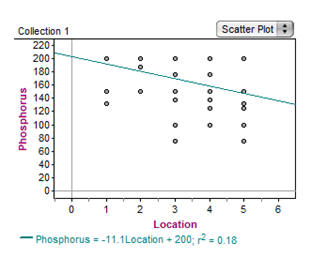
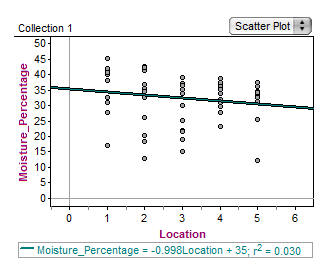
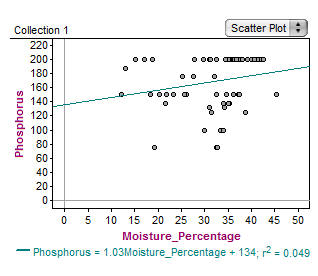
| Day 1 data for phosphorus and moisture graphs have a corrilation because there was no signifigance. The p-values were very high, therefore, there was no signifigance. | |
|
|
|
| Below are some of our most important p-values for phosphorus data and moisture p-values. The p-values show the statistical significance between two locations and can be found using a T-test. | |
|
|
|
 |
 |
 |
|
| Location had 18% impact on phosphorus. | Location had 3% impact on moisture. | Moisture had 5% impact on phosphorus. |
| These
graphs show location and moisture have an impact on phosphorus and
moisture but it does not have a large enough significance to prove our
hypothesis. However, it does support our hypothesis, but the
significance is not enough to prove our hypothsis as the main cause for
high phosphorus levels. |
||