EARTHWORMS AND ALUMINUM
WORMS OF STEEL
Data and Analysis
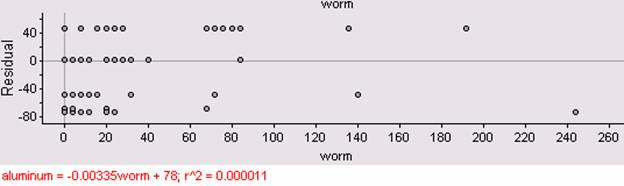
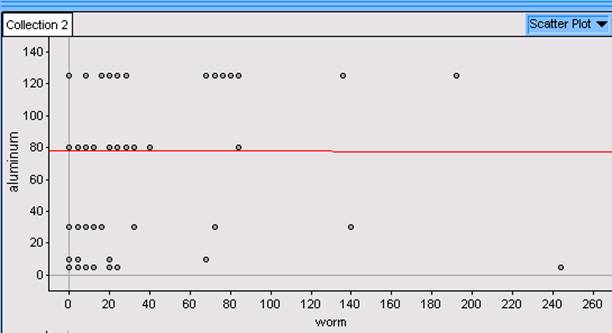
These are the results that we found during our research. These may not be the same as yours. Graph Two is the data that we found after doing our experiment. Every dot symbolizes the number of earthworms found per quadrant and the corresponding aluminum level for each sample. The residual plot graph one verifies that the information in graph two is statistically valid.
Residual Plot: (Graph 1)
Graph 2:
|
Worms of Steel! Procedure Discussion Data and Analysis What Not To Do Bibliography Acknowledgments Contact Us! |