Sample
Results
|
|
|
|
|
|
|
|
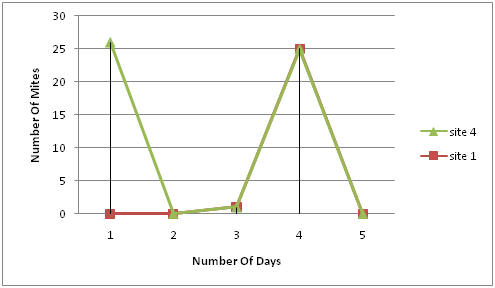
Here are some examples of what your graph or chart may look like.
Number of Days
Number of Days
After doing this experiment we found out that our hypothesis was wrong and that mites weren't the cause of protozoa not increaseing when bacteria decreased. After counting our bacteria plates and how many mites we found and then comparing them by the days to each other we saw that both the bacteria and mites went up at the same time. Then when bacteria went down so did the mites.
Then again you might find in your experiment that mites may be the cause of why protozoa didn’t increase when bacteria decreased. Or you might find out that its something else.