![]()
![]()
![]()
![]()
![]()
![]()
![]()
![]()
![]()
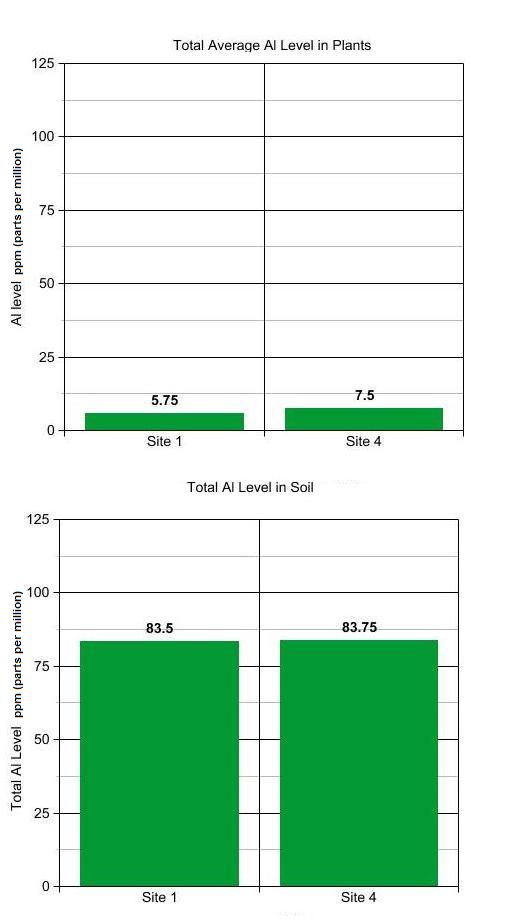
Aluminum in English Ivy: Soil and Plants
The graphs below show the aluminum levels in plants compared to the aluminum levels in soil. When the aluminum level in one type of plant is high, in this case and according to our hypothesis, the aluminum level in the corresponding graph should be low. When the graphs are like they are below the hypothesis is proven correct.
|
|
When completing an experiment like this, you can expect similar data such as the bar graphs above.
The data shown in the tables below are the raw data gathered by DL2 when they did this experiment. When doing this experiment, people can expect numbers like these depending where they live.
|
Aluminum Levels in Plant and Soil (Recorded in ppm) |
||
|
Trial One |
||
|
|
Plant |
Soil |
|
E.I 1 |
5 |
10 |
|
E.I 4 |
5 |
125 |
|
Paw Paw |
5 |
80 |
|
Jewelweed |
10 |
102.5 |
|
Trial Two |
||
|
|
||
|
E.I 1 |
5 |
55 |
|
E.I 4 |
5 |
10 |
|
Paw Paw |
5 |
125 |
|
Jewelweed |
5 |
102.5 |
|
Trial Three |
||
|
|
||
|
E.I 1 |
10 |
55 |
|
E.I 4 |
20 |
10 |
|
Paw Paw |
5 |
10 |
|
Jewelweed |
5 |
125 |
|
Trial Four |
||
|
|
||
|
E.I 1 |
5 |
125 |
|
E.I 4 |
7.5 |
55 |
|
Paw Paw |
5 |
125 |
|
Jewelweed |
5 |
102.5 |
|
Trial Five |
||
|
|
||
|
E.I 1 |
7.5 |
125 |
|
E.I 4 |
5 |
80 |
|
Paw Paw |
5 |
80 |
|
Jewelweed |
7.5 |
125 |
When finishing the experiment, you can record your data in an organized table such as the one to the left.