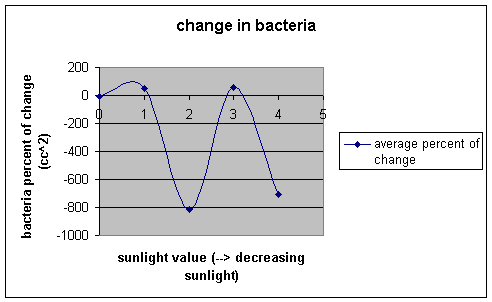

These are the averages of the data we collected. We averaged all the numbers for each condition of sunlight, before and after.
| plot | Average bacteria # Before per cc^2 | Average Bacteria# After per cc^2 |
| A | 2,977,777.77 | 2,232,222.22 |
| B | 137,777,777.78 | 10,152,222.22 |
| C | 13,555,555.56 | 18,700,000.00 |
| D | 15,833,333.33 | 6,877,777.78 |
| E | 7,444,444.44 | 37,658,888.89 |
According to our data graph, the sunlight has no significant effect on the growth of bacteria and does not cause the population to decrease. However, when T-Testing the collected data, we found that there was a significant difference between the bacteria levels in the soil before we manipulated the amount of sunlight. After the manipulating the bacteria amounts in the soil were not longer significant.

P-Values
Based on the P-values from the T-Testing something that happened during the manipulating of the sunlight, affected the bacteria in the plots. During our experiment, we experienced a heavy rain storm. We think that the rain may have affected the results, causing the bacteria amounts to no longer be significant.
| Before Sunlight Manipulating | plot number | P-Values | After Sunlight Manipulating | plot number | P-Values |
| negative control 0 (A) | vs. B | .06 | negative control 0 (A) | vs. B | .209 |
| negative control 0 (A) | vs. C | .02 | negative control 0 (A) | vs. C | .224 |
| negative control 0 (A) | vs. D | .03 | negative control 0 (A) | vs. D | .189 |
| negative control 0 (A) | vs. E | .04 | negative control 0 (A) | vs. E | .302 |
Conclusion: We found that the sunlight is not affecting the bacteria in site four.
Home Introduction Procedure Results and Analysis Troubleshooting Pictures Contact Info Bibliography Acknowledgements