
E.S.S.R.E. Microclimate Data Base


Because ecosystems, like living organisms, remain in a constant state of homeostatic flux, describing them accurately is one of the great challenges of environmental science. The number of annelids or bacteria, the levels of nutrients, and all the other biotic and abiotic factors can fluctuate seasonally, if not daily. Hence, one of the primary objectives of this program is to provide as thorough a database of information about the deciduous watershed on the Roland Park Country School campus as possible. We hope as a consequence to enable future students and researchers to develop richer hypotheses and create a more complete picture of our urban woodlands..
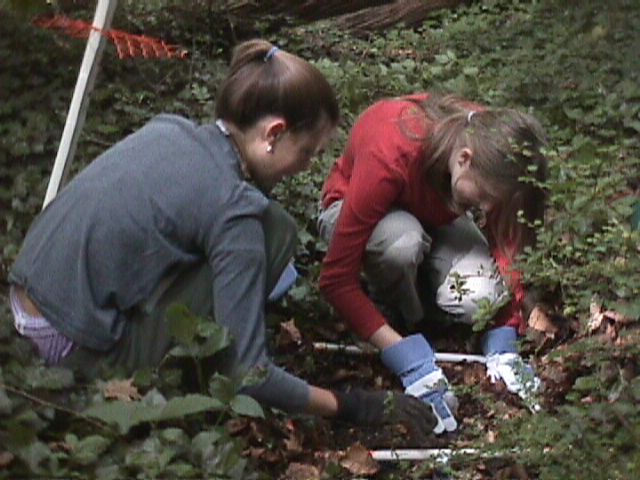
To achieve this goal, E.S.S.R.E. interns have performed general biota surveys each year of the program. Using the Smithsonian Institute Biodiversity Protocol as their model, they have collected data in each of the quadrants from the 20 x 20 meter sites in each of the four microclimates we are studying. This information includes soil texture, microbial population density, annelid & arthropod quantities, pH & inorganic nutrient levels, and plant diversity, and the specific survey results for not only each year but for the total time of the program can be found by clicking on the links below.
Starting in 2010, upgrades in the RPCS server allowed us to start providing all raw data along with the Annual Research Statistical Summaries. All older data are now archived in the Individual Quadrant Statistics (2001-2009).